If you have run codes in the emergency department or ICU, you already know that cardiac arrest management demands real-time feedback. Every intervention you make — from the depth of your compressions to the timing of your vasopressors — has consequences that play out over seconds, not minutes. For decades, clinicians relied primarily on pulse checks and rhythm analysis to navigate resuscitation. Today, quantitative waveform capnography and end-tidal CO2 (ETCO2) monitoring have become indispensable tools that give the code team a continuous, physiologic window into what is actually happening during CPR.
The 2025 American Heart Association (AHA) ACLS guidelines formally recommend waveform capnography in intubated patients during cardiac arrest, cementing a practice that evidence-based emergency physicians have championed for years. But understanding how to interpret ETCO2 values — and more importantly, how to act on them — requires more than memorizing a number. This article walks through the physiology, the clinical decision points, the waveform patterns, and the real-world limitations that every clinician managing a cardiac arrest should know cold.

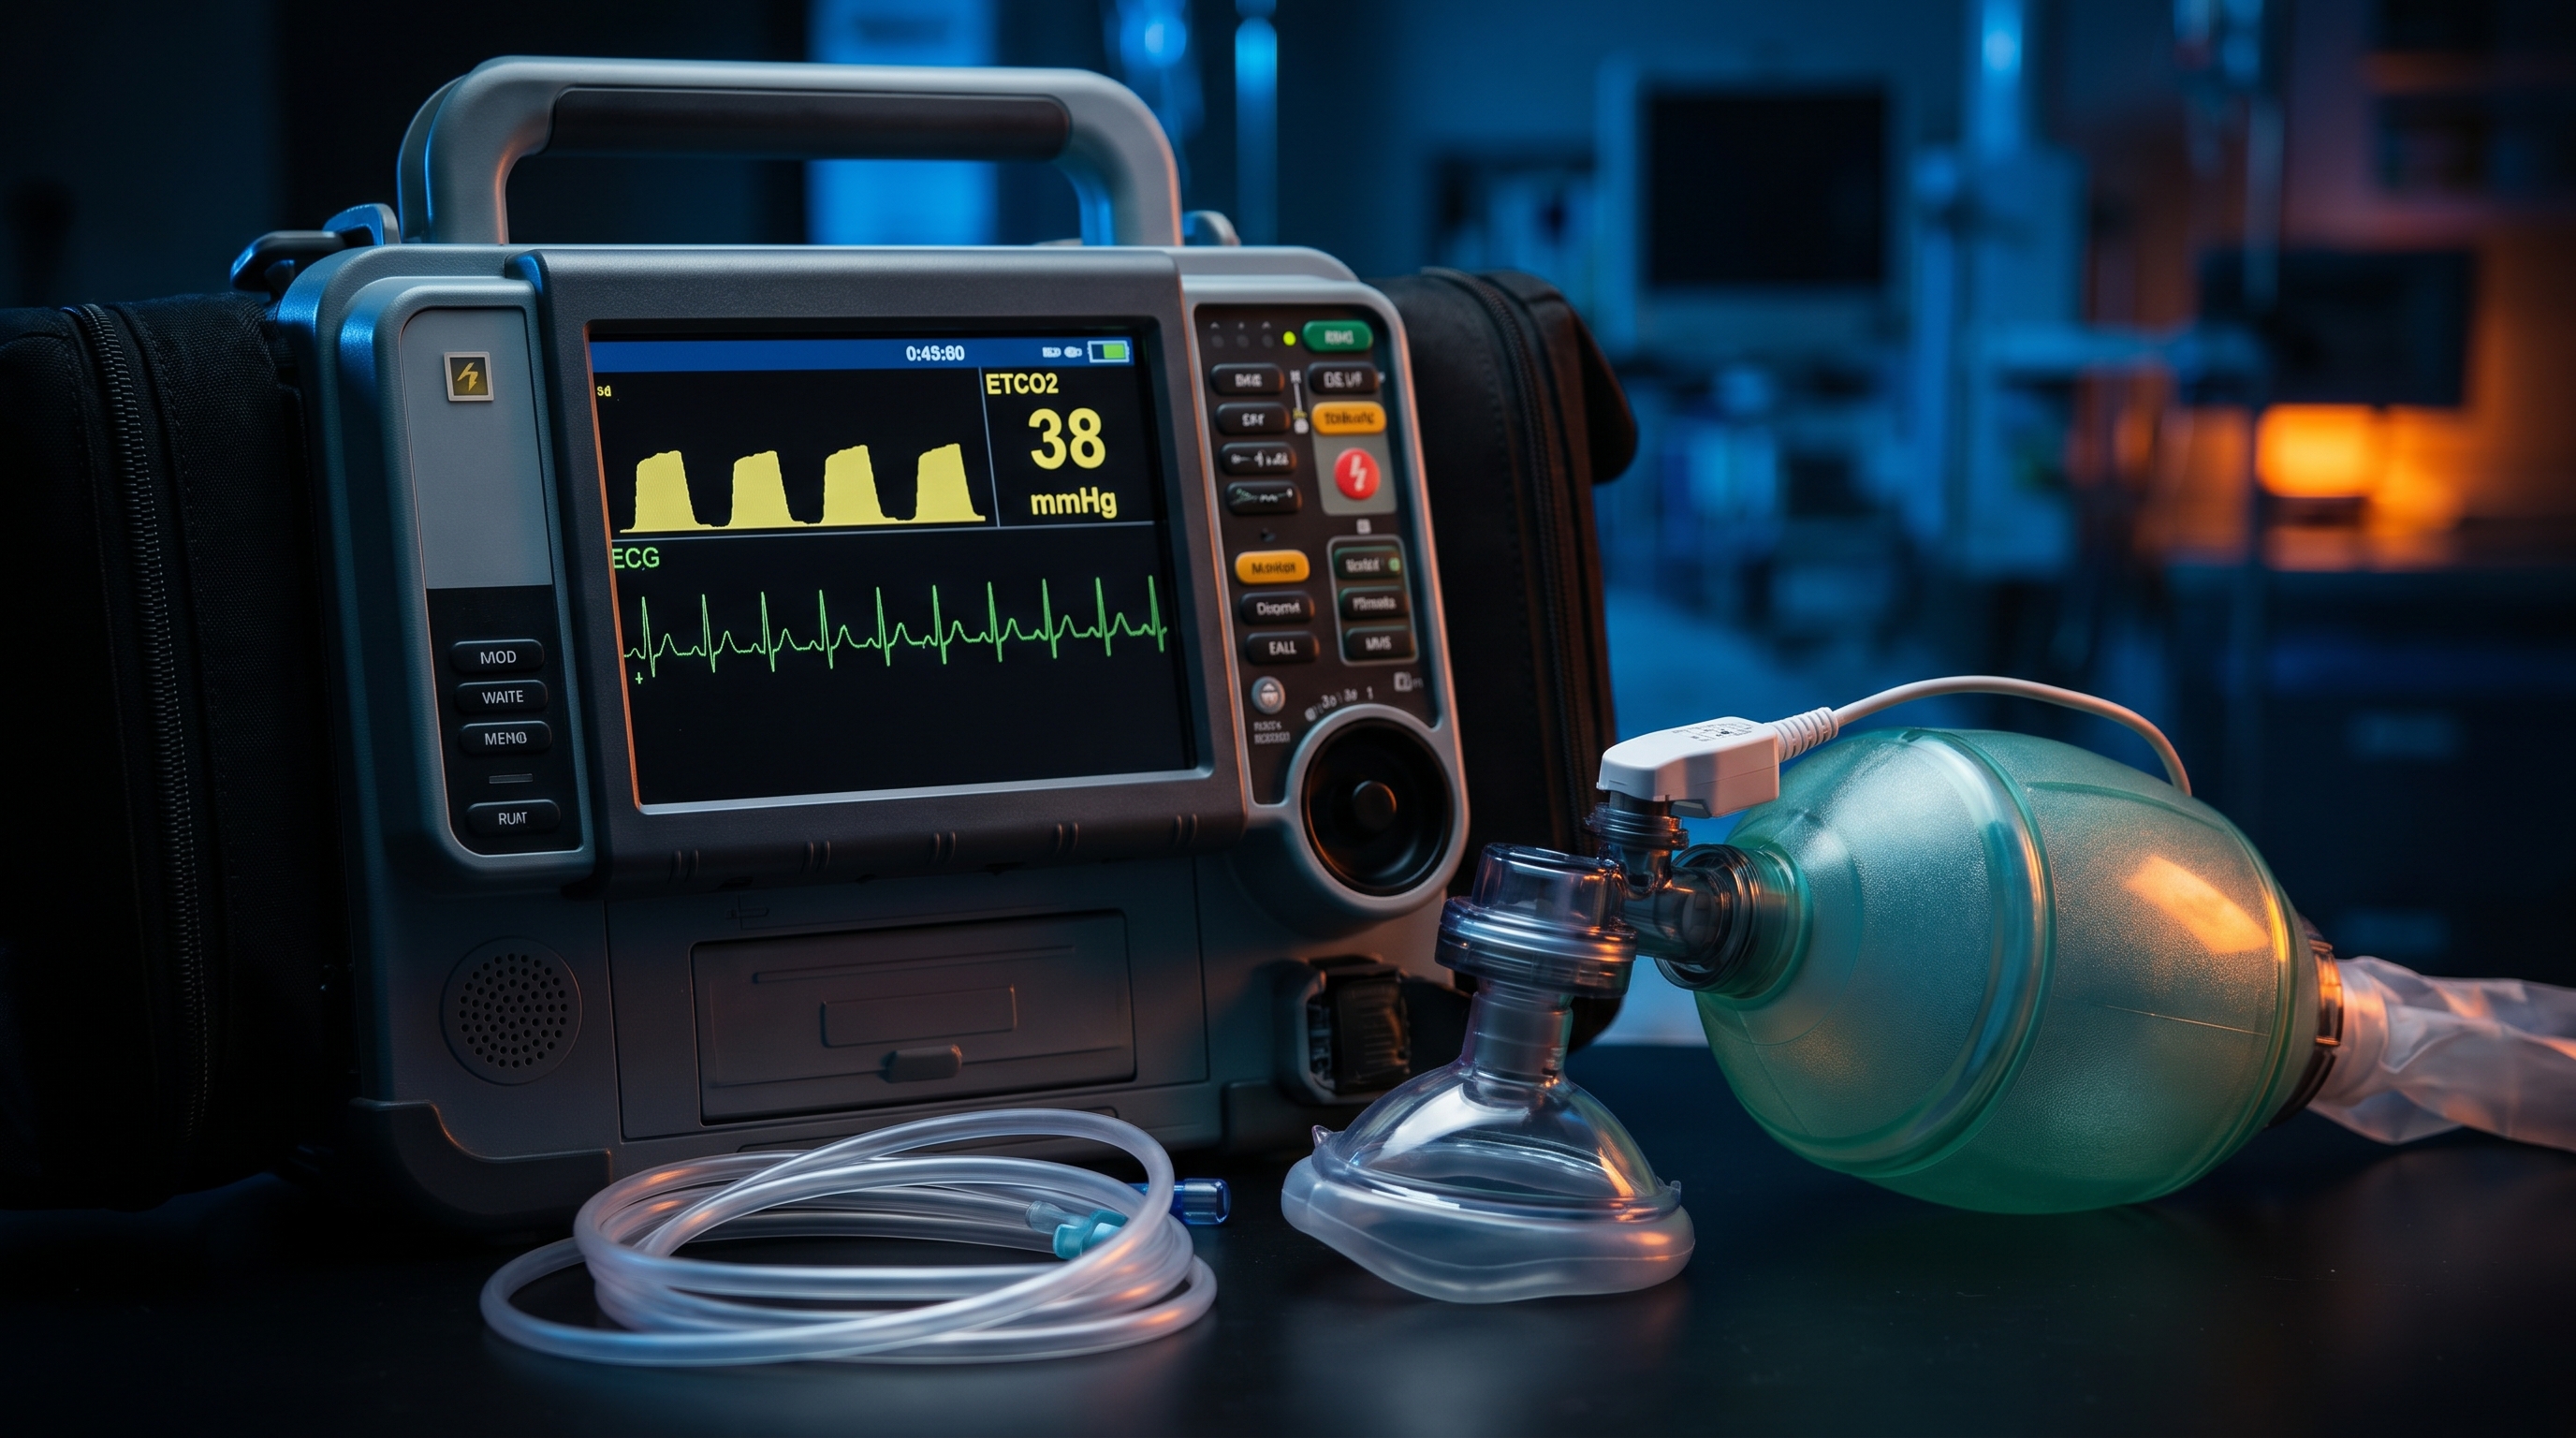
To use capnography intelligently during a resuscitation, you need a firm grasp of what ETCO2 actually measures and why it changes under arrest conditions. In a healthy, spontaneously breathing patient, ETCO2 reflects alveolar CO2, which closely mirrors arterial PaCO2. Normal ETCO2 in adults runs 35 to 45 mmHg. During cardiac arrest, however, this relationship changes dramatically.
When the heart stops, CO2 delivery to the lungs falls to near zero because there is no cardiac output to carry CO2 from the peripheral tissues to the pulmonary vasculature. Despite adequate ventilation, exhaled CO2 plummets. This means ETCO2 during cardiac arrest is primarily a function of cardiac output, not ventilation. The amount of CO2 reaching the alveoli is directly proportional to pulmonary blood flow — which, during CPR, is generated entirely by chest compressions. This physiologic fact is what makes capnography such a powerful real-time monitor during resuscitation: the number on the capnograph is essentially a continuous, noninvasive surrogate for the adequacy of cardiac output your team is generating.
When compressions are high quality — deep, fast, and allowing full recoil — more CO2 reaches the alveoli, and ETCO2 rises. When compressions are shallow, too slow, or interrupted, ETCO2 falls. This direct coupling between compression quality and ETCO2 is the foundation for using capnography as a CPR quality monitor throughout every phase of the resuscitation.
The first and arguably most critical use of waveform capnography during a cardiac arrest is confirming correct endotracheal tube (ETT) placement. The AHA identifies continuous waveform capnography as the most reliable method for verifying and monitoring ETT position — more reliable than auscultation, chest rise, or any other bedside assessment. Evidence supports 100% sensitivity and 100% specificity for identifying correct ETT placement during CPR when a waveform is present.
In practical terms: if you intubate and see a normal capnograph waveform — even a low-amplitude one given the reduced cardiac output — the tube is in the trachea. If you see a flat line with no waveform, you must immediately consider esophageal intubation, disconnect, and reconfirm placement. A critical caveat: in prolonged cardiac arrest, ETCO2 may be so low that the waveform is very small and difficult to read. In that scenario, correlation with direct laryngoscopic visualization, bilateral breath sounds, and fogging of the tube remains important. But a flat waveform after intubation should always trigger concern until proven otherwise.
It is also worth noting that supraglottic airway devices such as the laryngeal mask airway can be monitored with capnography, though waveforms may be less reliable due to air leakage around the cuff. For patients managed with bag-mask ventilation, waveform capnography is still recommended when feasible, though maintaining a mask seal during active compressions is a practical challenge the team must address systematically.
One of the most actionable applications of capnography during cardiac arrest is using it to optimize CPR quality in real time. The AHA recommends targeting ETCO2 values of at least 10 mmHg, and ideally 20 mmHg or higher, during active chest compressions in intubated patients. These thresholds are evidence-based: research consistently shows that ETCO2 values below 10 mmHg during CPR correlate with poor hemodynamics and significantly reduced survival rates.
From a team leadership standpoint, capnography changes how you coach compressions. Instead of guessing whether your compressor is doing enough, you have a number. If ETCO2 is sitting at 8 mmHg, you can say clearly: compressions need to be deeper and faster. If ETCO2 rises to 22 mmHg after the compressor changes technique, you have objective confirmation that quality improved. This real-time feedback loop is especially valuable in prolonged resuscitations where fatigue degrades compression quality over time — a well-documented phenomenon in cardiac arrest research.

For teams focused on high-performance CPR and team-based resuscitation strategies, capnography provides the objective metric that transforms subjective coaching into data-driven performance improvement. When you rotate compressors every two minutes as recommended, watching whether ETCO2 drops at the transition tells you whether the handoff was clean and compressions were truly uninterrupted. Pauses in compressions — even brief ones — produce immediate, visible drops in ETCO2 that hold the team accountable to minimizing interruptions and maximizing chest compression fraction.
Perhaps the most dramatic and clinically impactful use of capnography during resuscitation is the detection of return of spontaneous circulation (ROSC). When the heart begins beating again, cardiac output surges. CO2 that has been accumulating in peripheral tissues floods into the pulmonary vasculature, producing a sudden, sustained rise in ETCO2 — often jumping abruptly to 35 to 45 mmHg from a baseline of 10 to 20 mmHg during compressions. This spike is one of the most reliable, noninvasive signs of ROSC available to the resuscitation team.
The clinical significance is real. Pulse checks during active compressions are imperfect — arterial pulsations from compressions can be mistaken for a pulse, and stopping compressions for a prolonged check reduces coronary perfusion pressure. Capnography allows the team to continue compressions while watching for the ETCO2 surge that signals ROSC, reducing unnecessary pauses. The moment ETCO2 climbs sharply and sustains above 35 mmHg, that is the trigger to pause compressions and perform a rhythm and pulse check.
Understanding what happens immediately after ROSC is achieved — and the post-resuscitation care that follows — is essential for every team managing cardiac arrest. Post-ROSC care encompasses a coordinated bundle of interventions including targeted temperature management, hemodynamic optimization, and neurologic monitoring, all of which begin the moment circulation is restored. Capnography also has a role in the post-ROSC period, helping guide ventilation to maintain normocapnia (PaCO2 35 to 45 mmHg) and avoid both hypocapnia and hypercapnia, both of which worsen neurologic outcomes after cardiac arrest.
The prognostic implications of ETCO2 during cardiac arrest have attracted significant research attention. Multiple observational studies and systematic reviews have examined whether ETCO2 values can predict the likelihood of ROSC or survival. The findings are consistent but come with important nuance that every clinician must understand before applying them at the bedside.
The most-cited threshold is ETCO2 below 10 mmHg after 20 minutes of CPR, which is associated with a near-zero likelihood of ROSC — approximately 0.5% in several studies. An ETCO2 above 20 mmHg at 20 minutes of CPR, by contrast, correlates with meaningfully higher survival rates and has been proposed as a criterion for considering patients for rescue extracorporeal CPR. According to a systematic review published in Resuscitation, ETCO2 measurements of 10 mmHg or greater at various time points during CPR are substantially associated with ROSC, though the quality of available evidence is moderate and must be interpreted accordingly.
However — and this is critical — ETCO2 should never be used in isolation to make a decision to terminate resuscitation efforts. The AHA guidelines explicitly state this. Multiple confounders affect ETCO2 readings: sodium bicarbonate administration produces a transient CO2 surge that can falsely elevate ETCO2 without reflecting improved cardiac output; epinephrine transiently reduces ETCO2 by increasing pulmonary vascular resistance; obesity, pulmonary embolism, and severe metabolic acidosis can all distort the relationship between cardiac output and ETCO2. Trending values over time — not a single data point — is the clinically appropriate approach to ETCO2 interpretation.
For cardiac arrests involving pulseless electrical activity (PEA), ETCO2 plays a particularly valuable role. PEA has reversible causes that must be identified and treated rapidly, and ETCO2 monitoring can help differentiate true electrical-mechanical dissociation from pseudo-PEA, where cardiac output is present but too low to detect by pulse check alone. A rising ETCO2 in a patient with PEA rhythm may indicate improving cardiac output from treatment of the underlying cause, giving the team a physiologic signal to continue aggressive management.
Quantitative capnography gives you a number; waveform capnography gives you a story. The standard capnograph waveform — the normal rectangular wave — has distinct phases that convey information about ventilation, airway patency, and circulation. During cardiac arrest, the waveform morphology changes in ways that carry real diagnostic weight for the attentive clinician.
During CPR with an advanced airway in place, the normal waveform is replaced by compression artifacts superimposed on a low-amplitude CO2 baseline. Each compression cycle produces a small CO2 oscillation. The baseline amplitude of these oscillations reflects cardiac output. A sudden shift from this low-amplitude oscillating pattern to a full rectangular waveform is a reliable indicator of ROSC and should prompt an immediate pause for rhythm and pulse check without hesitation.
Waveform abnormalities can also flag airway problems. A shark fin waveform — where Phase II (the ascending portion) rises slowly rather than steeply — suggests bronchospasm, mucus plugging, or obstructive airway disease. During cardiac arrest this is easily missed because the overall amplitude is low, but in patients with known asthma or COPD who arrest, it may indicate that incomplete exhalation is contributing to air trapping and dynamic hyperinflation — a reversible cause that addresses the broader framework of arrest reversibility. The Hs and Ts of cardiac arrest encompass the full range of reversible causes your team must systematically consider during any resuscitation, and capnography waveform analysis can contribute to identifying several of them in real time.
A sudden drop in ETCO2 to near zero during CPR — without a change in compression technique — may signal ET tube displacement, circuit disconnection, or kinked ventilator tubing. The waveform becomes flat. Immediately check the airway: confirm tube position, check connections, and resume ventilation. This is a signal no resuscitation team should dismiss or delay responding to.
Different cardiac arrest rhythms behave differently on capnography. In ventricular fibrillation (VF), the initial ETCO2 at the onset of arrest tends to be higher because some pulmonary blood flow is maintained in the early moments of the arrhythmia. After successful defibrillation, a sharp ETCO2 rise typically precedes or coincides with restoration of organized rhythm and pulse. For teams managing ventricular fibrillation and shockable cardiac rhythms, recognizing this post-shock ETCO2 surge can help confirm successful defibrillation even before a pulse is clearly palpable.
In asystole, ETCO2 is typically very low from the outset, reflecting the complete absence of cardiac output. A persistently flat ETCO2 throughout a resuscitation of asystole — particularly in combination with prolonged downtime, non-witnessed arrest, and absence of reversible causes — contributes to the clinical picture informing decisions about termination of efforts, though again, it is never the sole criterion and must always be interpreted within the full clinical context.
For shockable rhythms — VF and pulseless ventricular tachycardia (pVT) — the ACLS algorithm prioritizes early defibrillation alongside high-quality CPR. Capnography during the two-minute cycles between shock attempts provides continuous feedback on compression quality and can detect ROSC without requiring a hands-off pulse check. This keeps coronary perfusion pressure elevated and improves the physiologic conditions for successful defibrillation on subsequent attempts — a meaningful advantage in managing refractory shockable rhythms.
Using ETCO2 well requires understanding the factors that can distort its signal. Several common resuscitation interventions directly affect ETCO2 readings in ways that can mislead clinicians who are not prepared for them. Knowing these confounders transforms you from a passive monitor-watcher into a sophisticated interpreter of capnography data.
Sodium bicarbonate is the most commonly cited confounder. When sodium bicarbonate is administered intravenously, it generates CO2 as it buffers hydrogen ions. This CO2 is carried to the lungs and exhaled, producing a transient spike in ETCO2 that can mimic ROSC. Clinicians who have just administered bicarb and then see a sudden ETCO2 rise should not assume ROSC without a confirmatory pulse and rhythm check. The spike from bicarbonate is typically transient and resolves over one to two minutes as the bolus clears.
Epinephrine paradoxically reduces ETCO2 by causing pulmonary vasoconstriction, which decreases pulmonary blood flow despite increasing systemic vascular resistance and coronary perfusion pressure. This means ETCO2 may transiently fall after epinephrine administration even if compressions remain excellent and coronary perfusion pressure has improved. Teams should be aware of this effect and avoid interpreting a transient post-epinephrine ETCO2 drop as worsening CPR quality or deteriorating prognosis.
Other confounders include massive pulmonary embolism, which increases dead space and lowers ETCO2 disproportionately to cardiac output; hyperventilation, which washes out alveolar CO2 and artificially lowers ETCO2; severe metabolic acidosis, which increases CO2 production and may elevate ETCO2; and profound obesity, which increases CO2 production and alters ventilation-perfusion matching. In all these scenarios, trending ETCO2 over time and interpreting values in full clinical context is essential. Point-of-care ultrasound used alongside capnography can help identify confounders like massive PE and cardiac tamponade that distort the ETCO2 signal, making multimodal monitoring far superior to any single parameter alone.
As extracorporeal CPR (ECPR) becomes more available at advanced resuscitation centers, ETCO2 is playing an emerging role in identifying candidates. Prolonged resuscitation with ETCO2 values persistently above 20 mmHg — indicating that adequate compressions are maintaining some degree of tissue perfusion — may support a decision to cannulate for ECMO rather than terminate efforts. By contrast, ETCO2 values persistently below 10 mmHg despite optimal CPR and treatment of reversible causes may indicate that perfusion is inadequate to sustain viable tissue, informing prognosis even in ECPR-capable centers where resources must be allocated carefully.
Extracorporeal CPR represents the cutting edge of cardiac arrest management, and the integration of capnography data into ECPR candidacy decisions is an active area of clinical research. As ECPR protocols evolve, ETCO2 thresholds are likely to be incorporated into formal selection criteria alongside factors like witnessed arrest, shockable rhythm, time to CPR initiation, and comorbidity burden.
Capnography data is only useful if it is communicated clearly and acted upon systematically by the resuscitation team. The team leader bears responsibility for monitoring the capnograph, interpreting values, and translating them into real-time coaching and clinical decision-making. This requires deliberate communication practices that keep every team member informed and responsive to what the monitor is showing.
Effective code team communication around capnography sounds like this: “ETCO2 is 8 mmHg — compressor, go deeper and faster. Our target is at least 20.” Or: “ETCO2 just jumped to 40 mmHg — pause compressions, check for pulse and rhythm.” Scripted, closed-loop communication around capnography values prevents the monitor from becoming background noise and ensures the team is responding to data in real time. Structured ACLS team communication scripts are proven tools for improving code outcomes and should explicitly incorporate capnography callouts as part of standardized resuscitation language used by every member of the team.
Assigning a dedicated person to monitor and call out the capnograph value at regular intervals — every two minutes, and immediately upon significant changes — is a practical strategy for busy resuscitation environments. Some institutions have incorporated ETCO2 values into their code documentation sheets, creating a timestamped record of capnography trends alongside interventions. This both improves real-time decision-making and provides valuable post-arrest debriefing data that teams can use to improve future performance. According to research on physiologic monitoring of CPR quality, teams that systematically use monitoring data during resuscitation demonstrate improved performance metrics and better clinical outcomes compared to those who do not.
Capnography and ETCO2 interpretation are tested concepts in ACLS certification and recertification. Understanding how to apply capnography during a cardiac arrest — not just as a theoretical concept but as a practical, decision-guiding tool — is a competency that distinguishes clinicians who merely know the algorithms from those who can run a sophisticated, data-driven resuscitation. The 2025 AHA guidelines that underpin current ACLS certification place capnography squarely in the center of physiologic monitoring during cardiac arrest, and certification assessments increasingly reflect this clinical reality.
For healthcare professionals seeking to deepen their mastery of these concepts while maintaining certification efficiently, Affordable ACLS offers fully online, self-paced ACLS certification and recertification courses developed by Board Certified Emergency Medicine physicians who use capnography clinically every day. The course is built on current AHA and ILCOR guidelines, costs just $99 for certification and $89 for recertification, and delivers your digital certificate immediately upon completion — with unlimited retakes and a money-back guarantee. You complete the course on your schedule, not ours.
Whether you are a nurse, physician, paramedic, or respiratory therapist, understanding capnography at this level — the physiology, the thresholds, the confounders, the waveform patterns — prepares you to function at the highest level during the moments that matter most. Certification should reinforce that clinical expertise, not just test it superficially. Research on capnography during CPR from PMC confirms that systematic integration of ETCO2 monitoring into resuscitation practice is associated with improved CPR quality and better-informed clinical decisions at every stage of the resuscitation.
Capnography and ETCO2 monitoring have moved from adjunctive tools to central components of evidence-based ACLS practice. The physiologic logic is compelling: during cardiac arrest, ETCO2 is a noninvasive, continuous, real-time surrogate for the cardiac output your team generates through chest compressions. Used correctly, it confirms airway placement with certainty, guides compression quality in real time, detects ROSC without interrupting compressions, contributes prognostic information over the course of a resuscitation, and helps identify confounders and reversible causes that would otherwise go undetected.
The critical skill is integrating ETCO2 data into the full clinical picture — not reading it in isolation, not being fooled by sodium bicarbonate spikes or post-epinephrine dips, and always trending values over time rather than reacting to single data points. Clinicians who have internalized both the power and the limitations of capnography are equipped to run more effective, more data-driven resuscitations. That is exactly the kind of applied clinical knowledge that separates competent code management from truly excellent resuscitation leadership in the modern era.
The evidence base supporting capnography in cardiac arrest continues to grow and deepen. Landmark research in the New England Journal of Medicine established the foundational prognostic relationship between ETCO2 and cardiac arrest outcomes, and subsequent systematic reviews have refined the clinical thresholds that now inform AHA guidelines and clinical practice worldwide. Research published in Resuscitation continues to validate capnography as a cornerstone of modern cardiac arrest management. As technology advances — including integration of capnography with CPR feedback devices and point-of-care monitoring systems — the role of ETCO2 in resuscitation will only expand. Stay current, stay certified, and stay committed to the science that saves lives.
.jpg)